Forget About Your Food Inventory Turnover Formula
There are more insightful and actionable restaurant inventory management metrics you should be concerned about than a food inventory turnover formula. This article dives into three such metrics and why they’re better than restaurant inventory turnover ratios.
Continue reading to learn:
Why turnover ratios aren’t a valuable restaurant metric
It’s not like the restaurant industry’s turnover ratio is different from other industries. It’s all the same formula:
Inventory Turnover Ratio = Cost of Goods Sold ÷ Average Inventory Value
The idea behind the ratio is simple enough—a healthy business frequently sells through its inventory and has to replenish it. The more times the inventory turns over during a given period, the healthier the business.
The reason the ratio is so popular is because it’s a quick and easy assessment for accountants, executives, investors, and other parties. All you need is COGS and an average inventory value over the same period of time.
Some reasons that turnover ratio is suboptimal for your daily restaurant inventory management include:
- Highly perishable food items
- Ever-changing menus
- Dynamic nature of specials, holidays, one-off catering gigs, etc.
Along with these reasons, food turnover ratio is suboptimal because it doesn’t cut deep enough into your actual inventory health and business performance—which is critical with ongoing rising food costs and supply chain disruptions.
What restaurant inventory metrics provide actionable insights
The emphasis of this blog is the importance of harnessing and acting on precious inventory insights.
If all you have is a food inventory turnover ratio, at least it’s something. A turnover ratio is better than nothing when it comes to measuring your operation’s inventory health — but here are three inventory metrics that provide immediate and actionable insights:
Depleting Inventory
Depleting inventory isn’t technically that different from inventory turnover, but its subtle difference makes it much more insightful.
Rather than returning a ratio of inventory turnovers, depleting inventory measures how quickly your restaurant(s) goes through a specific product.
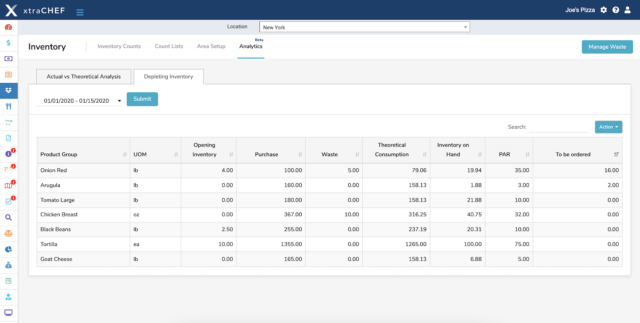
Our platform’s depleting inventory reports calculate how much inventory you theoretically have on hand and how much you need to order to maintain par — par being the average inventory you need to have on hand to meet projected sales.
The value here is in increasing order accuracy and inventory efficiency (not over or under-stocked but exactly what you need) on a monthly, weekly, and even daily basis.
Actual vs Theoretical Variance
Actual vs Theoretical cost analysis highlights the difference (aka variance) between your actual inventory consumption and your theoretical inventory consumption over a set time. The variance is expressed as a dollar value, percentage, or physical quantity.
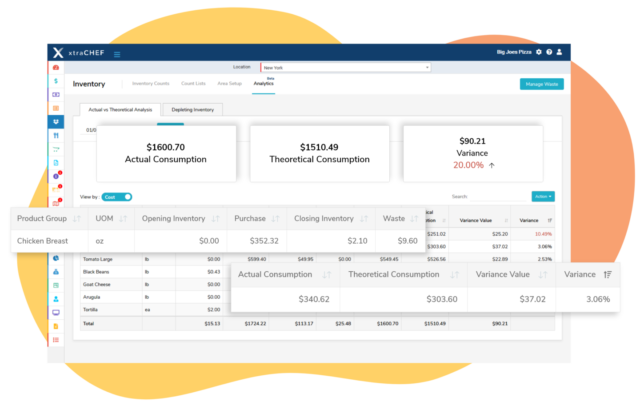
xtraCHEF’s variance analysis compares theoretical and actual inventory levels over a given period of time — daily, week-over-week, month-over-month, etc.
The value here is drilling into which areas and individual products are causing variance in your AvT analysis and identifying ways to reduce or at least plan for the variance.
Physical Inventory Counts
Someone in your restaurant(s) needs to get hands-on inventory counts on a regular basis. And if you’re taking the time to do it right, casual pen and paper counts won’t cut it.
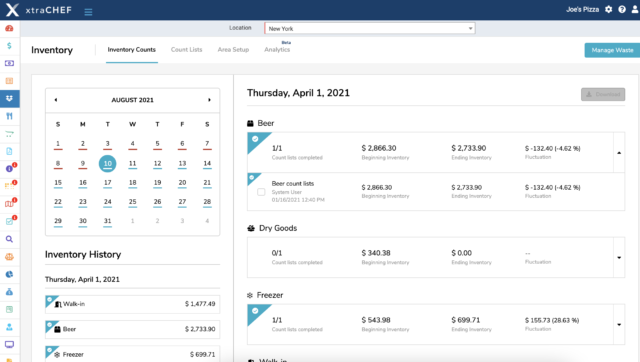
Accurate and efficient inventory counts require scheduling, organization, and should pull information from recent invoices. This way you have an idea of what’s on-hand.
The value here is eliminating as much human error as possible, including the products being counted, their location, and recording actual counts.
How to harness and implement actionable restaurant inventory insights
You’ll need to consistently source a few different data sets to implement the above metrics:
- Theoretical counts based on invoice orders. This is where you understand how much of each product you should have on hand. Automated invoice processing is the most efficient way to achieve your theoretical counts.
- Recipe management data tied to your inventory system. This is how you quantify how much of each individual ingredient actually & theoretically goes into a sold menu item. Recipe management is what you need to determine ingredient-level costs and usage for each dish you sell.
- Actual sales data from your point-of-sale. This is how you know what your actual sales are for each menu item. Actual sales data from your POS rounds everything out, providing true COGS and other metrics.
![]() xtraCHEF is built on invoice processing automation. With a quick photo from our app, a scanned upload, or direct EDI feed, we take your invoices (food vendors, utilities, and more) and ingest their data into our system.
xtraCHEF is built on invoice processing automation. With a quick photo from our app, a scanned upload, or direct EDI feed, we take your invoices (food vendors, utilities, and more) and ingest their data into our system.
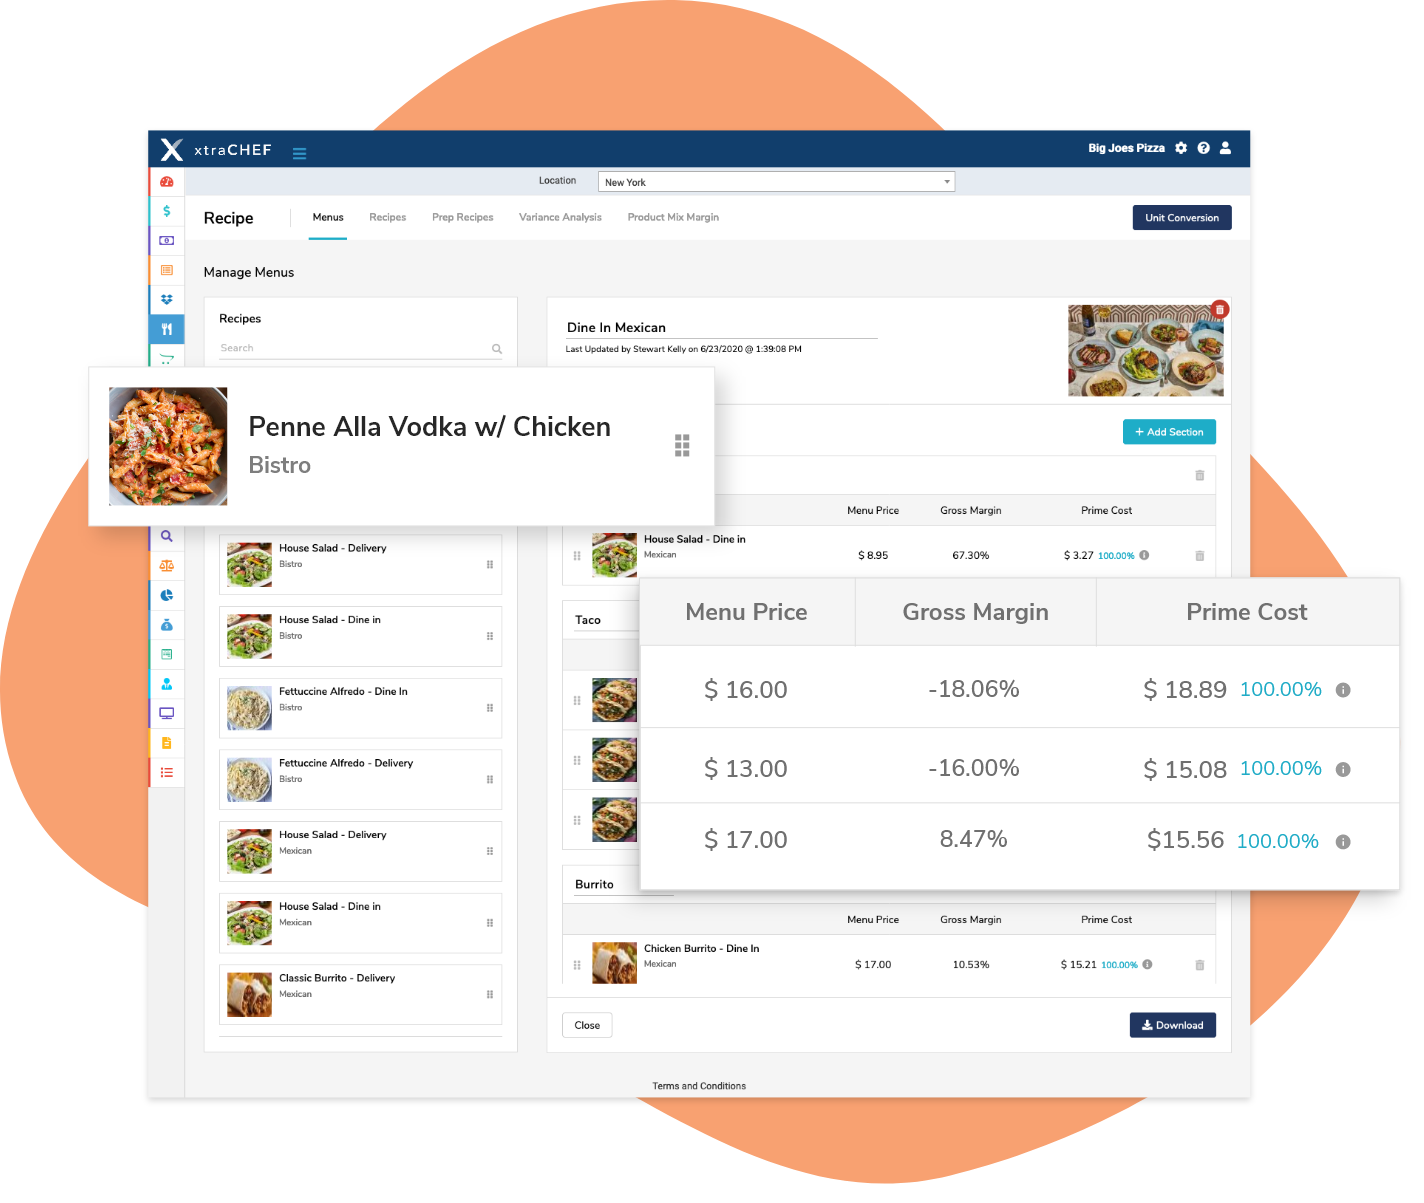
xtraCHEF takes your invoice data and allows you to assign individual ingredient quantities to specific recipes. We know from your invoice that a case of chicken thighs is 5lbs and costs $30. And with one-time recipe building on your part, our platform can also see that each chicken sandwich is about 4oz of chicken thigh, or ~$1.50 without factoring in waste, shrinkage, etc.
xtraCHEF by Toast seamlessly integrates sales and PMIX data from Toast into xtraCHEF, automatically accounting for purchases and waste. Map menu items and modifiers mapped in Toast to recipes and recipe modifiers in xtraCHEF to calculate theoretical consumption and par inventory needs. And rectify anticipated and actual margins based on daily sales, discounts, etc with variance deep-dives.
If you want to optimize your restaurant inventory management and more, what are you waiting on? Schedule your xtraCHEF by Toast demo today and start measuring what matters!
Let xtraCHEF do your dirty work.
See how our platform sets restaurants of all sizes and service levels up for success by scheduling a demo with a Product Specialist.
